
Successful businesses use methodical approaches to achieve their goals. In today’s data-rich environment, data is the lifeblood of informed decision-making. Business Intelligence (BI) transforms raw data into meaningful insights, enabling strategic decisions with confidence. By harnessing BI, organizations can analyze operations, identify trends, and uncover growth opportunities.
Business Intelligence tools like Microsoft Power BI offer features for creating visualizations, real-time reporting, and interactive dashboards. They seamlessly integrate various data sources and support extensive data exploration, analysis, and presentation. Implementing BI tools empowers businesses to monitor performance indicators, manage projects, and track operations, providing a clear view of progress toward strategic goals and helping to respond swiftly to changes.
Streams Tech leverages BI technology and the solid expertise of its staff to deliver tailored solutions with dynamic, customizable dashboards. Our scalable BI services grow with clients, ensuring application reliability, data integrity, and security.
With a team skilled in database design and cloud application development, Streams Tech excels in addressing clients’ complex needs beyond off-the-shelf BI packages. Partner with Streams Tech to gain powerful analytical capabilities and a dedicated ally in driving success through data.

Project Type
Web-based BI Application
Client
Ezispeak
Streams Tech utilized Microsoft’s Power BI to build an application embedded in Ezispeak’s website to help prepare client-specific dashboards and reports. Ezispeak, which is a renowned Australian company, offers real-time language interpretation services. The application includes modules for service and support, scheduling, reporting on key performance indicators (KPIs), invoicing, and contract administration. The KPI reporting module collects necessary data, such as the total number of serviced calls, average call duration and answering time, language services provided, etc., and prepares summaries incorporating charts and tables. Ezispeak clients can securely access their customized portals to view reports and invoices.
Project Type
Web-based BI application
Client
US-based Law Firm
Law firms in USA charge clients by hour. Keeping track of expected and actual hours by client and billing rate of employee helps senior management get a clear insight on revenue, utilization, client type, and profit by each attorney, group or the entire office. Streams Tech developed a secure web-based dashboard for a law firm, having multiple offices in ten states, to monitor the performance, billing, profitability, and new client acquisition rate of each attorney. The system also allowed exporting the reports in PDF format and automatically emailing them to selected people.


Project Type
BI Application
Client
DynamicWeb
DynamicWeb offers an e-commerce platform to its customers, providing a solution for integrated management of project resources, such as availability, attendance, engagement and labor reports. Streams Tech conducted the research and development (R&D) and developed a dashboard, that allowed DynamicWeb clients to view both tabular and graphical data of project teams. Any authorized client-team member could measure progress and learn the status of projects by viewing dynamic KPIs, charts, and graphs.
Project Type
Web-based BI application
Client
California-based Law Firm
A reputed California-based real-estate-law firm uses an off-the-shelf software to store data as cases pass through various stages, including case filing, servicing, judgment, holding, closing, and rescheduling. They needed technical support to overcome the limitations of the software, especially to generate customized reports. Streams Tech developed tools to extract data from the case management software, built an appropriate data model, and created a dashboard, including visual displays, using Microsoft Power BI. This software package helped the client view current cases; case status; attorney performance; cases by client, state or stage requiring attention; and expected schedule and actual progress. It provided information on how efficiently and profitably cases were handled in different states and allowed the client to allocate resources to maximize success.


Project Type
BI Application
Client
Freebee
Streams Tech created a fleet management dashboard for an electric vehicle (EV) services company based in Florida, USA. Utilizing a large amount of user, traffic, and product data collected through the client’s app, the dashboard offered an in-depth analysis and graphical display of driver and passenger ratings, demographics, and customer feedback. It also allowed company officials to make optimal use of their resources and deliver superior customer service using real-time information.
Project Type
BI Application
Client
Dynamic Web
Streams Tech developed an interactive dashboard for Dynamic Web using Power BI to extract data directly from the source applications, filter the data, and generate reports to forecast revenue. The dashboard allowed the client’s C-level executives to easily obtain forecast summaries, which included goal indicators, goal status, daily revenue, hours allocated to each resource and cost, etc. Display of financial data helped managers gain insights into budgets, achieve project goals, and boost output.


Project Type
BI Application
Client
Gapminder
Gapminder, a Swedish foundation, disseminates fact-based information about the world and environment. It presents facts and figures based on statistical analysis of multidisciplinary data, including social, economic, political, demographic, geographic, climate, ecologic, and environmental. Streams Tech provided software development support to Gapminder in building challenging tools to fetch and standardize data that has no limits in volume and variation, perform data analysis, and present for visualization.
Project Type
BI Application
Client
Signature Trend Advisory
Steams Tech created a comprehensive web-based portal for a government agency in Brunei collaboration with Signature Trend to provide a synopsis of price, production, and market of agricultural commodities. The interactive dashboard also presented decision makers with useful insights on geographical characteristics of farm products, farmer demography, and crop value by type and year.

Project Type
BI Application
Client
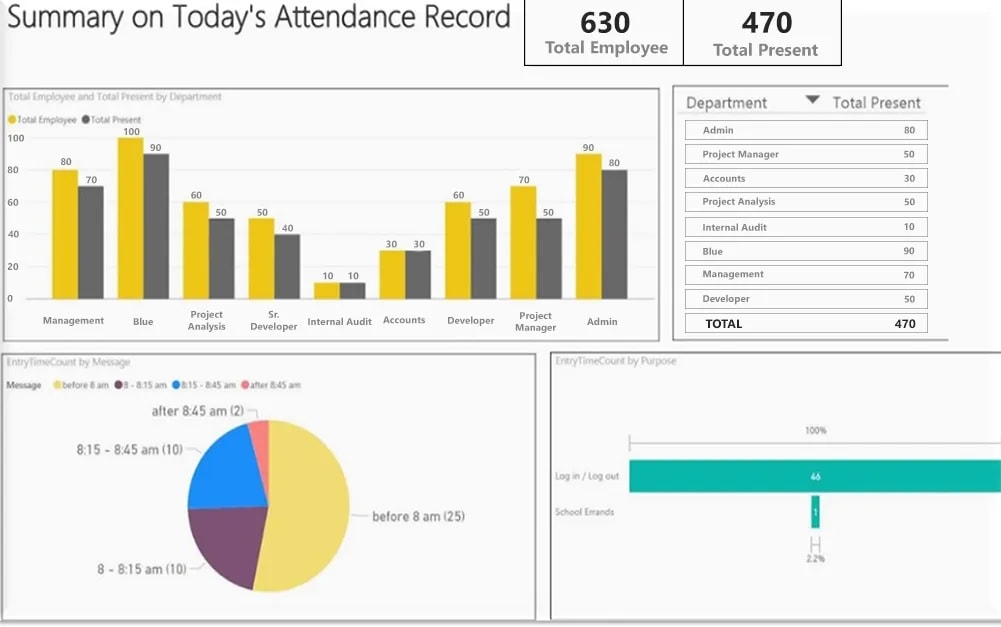
Signature Trend Advisory
Streams Tech provided programming and technical support to Signature Trend Advisory (ST Advisory) of Malaysia for the development of an attendance management dashboard. This browser-based dashboard utilized Power BI to track sign-in, sign-out, and leave balances of employees and generate reports. The application aided the client in efficiently monitoring attendance and increasing performance.
